Feature available in: PRO and ADVANCED PLANS
(US, UK, France and Belgium only)Whether for a presentation or a business plan, it can be useful to have all the population data in an Excel file; the file will also include charts and tables. smappen enables you to generate, with a single click, an Excel document summarizing the population data for a catchment area.
If you want to extract the population data for an area, select the area to be analyzed by:
- Clicking on it on the map
- Clicking on its name on the area-management panel
- Selecting it from the drop-down list on the Analytics and data panel
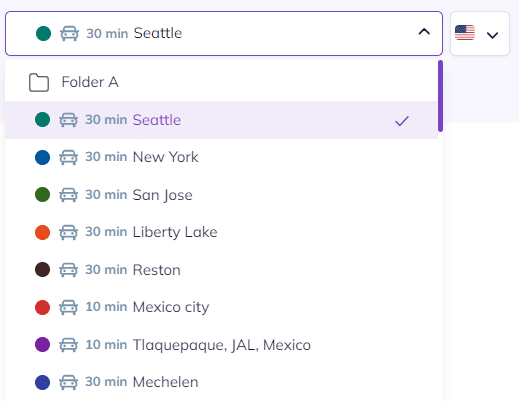
To extract population data for a folder (i.e. all the cities in all the areas included on the folder), select the folder to be analyzed from the drop-down list on the analytics and data panel:

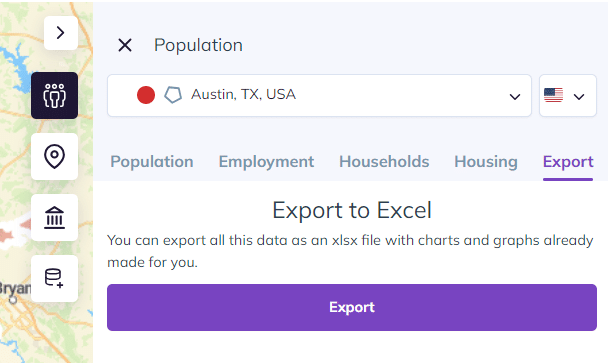
On the analytics and data panel, click on “Population”:

Wait until the extraction is finished, then click on “Export (Excel)”:


The generated Excel spreadsheet has six tabs:
- Area: contains an image of the area and key data about it
- Population: contains the area’s demographic data
- Employment: contains the employment data for the area
- Housing: contains the housing data for the area
- Household: contains data on the make-up of households in the area
- Raw data : contains all demographics available in Smappen
For the US : not only those displaid in the app. You can also access them with the My Metrics feature. See details here.
FAQ #
🟢How to export population data for all my areas at once?
To export population data for all your areas in a single Excel file, start by creating the metrics you need in the My Metrics tab.
Once your metrics are set, you’ll be able to export them for all the areas on your map at once.
Here are the relevant help articles:
👉 Create and Manage your Custom Metrics
👉 Exporting My Metrics for your areas into a single Excel file
Note: Multi-area export is available on the Advanced plan only.
Please make sure your subscription includes this plan — you can upgrade your plan at any time from your profile.
To go further:
