Did you know that 80% of the factors influencing a franchise’s success are related to its location? This statistic underscores the crucial role that a carefully chosen site plays in the profitability and sustainability of a franchise. With the rise of sophisticated tools and technologies, spatial analysis has become a game-changer for franchisors, enabling data-driven decisions that significantly enhance the likelihood of success.
Let’s dive deep into it!
Understanding spatial analysis
Spatial analysis refers to examining the locations, attributes, and relationships of features in spatial data through various analytical techniques. It involves interpreting geographic data to identify patterns, trends, and relationships that might not appear immediately. This type of analysis is crucial in understanding spatial relationships and making informed decisions based on geographical insights.
The role of spatial analysis in site selection
Let’s discover how geospatial analysis can supercharge your market research to find the perfect franchise spot. With spatial analysis, you can tap into rich demographic and economic statistics to uncover the best spots for your business.
Market research
Imagine having the ability to pinpoint areas where your target customers live, work, and shop. Location analysis looks at population density, age groups, and income levels to help you find neighborhoods filled with your ideal customers. It’s like having insider knowledge of where people are spending their money and what they’re interested in.
Local economy and competitor analysis
Beyond demographics, spatial analysis gives you insights into the local economy. By examining employment rates and business activity, you can choose locations with strong consumer spending power and a vibrant economic scene. Plus, it analyzes the competitive landscape to ensure you’re not setting up shop in an oversaturated market, giving you a strategic edge.
Visibility and accessibility
Traffic patterns and accessibility are also key factors. Using geospatial analysis means picking spots that are easy to find and get to, so your franchise gets noticed in a great location. In short, spatial analysis provides a comprehensive, data-driven approach to site selection, helping you make informed decisions that maximize your franchise’s potential for success.
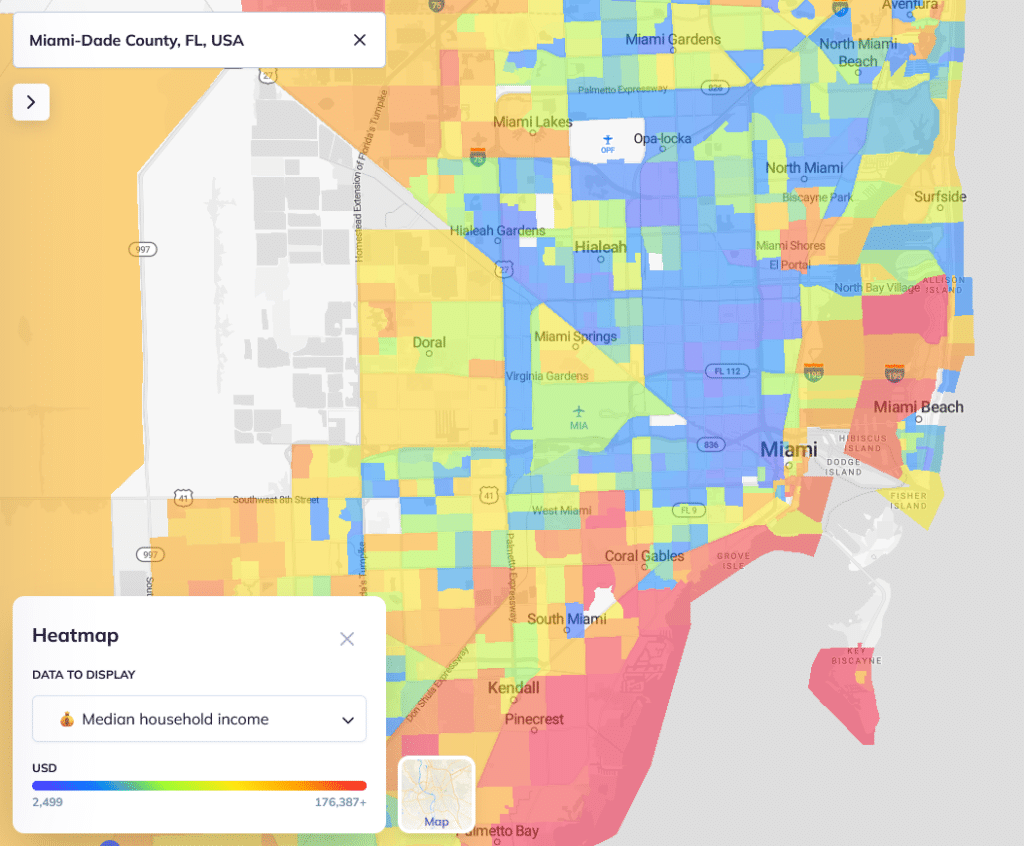
Demographic Insights on a Map: The Perfect Match
If you look at the numbers and where people live, you can figure out where your best customers are hanging out based on things like how old they are, what they do for a living, and how big their families are. You can use a demographic map to visualize these insights and put your franchise in the right spot where your customers are hanging out.
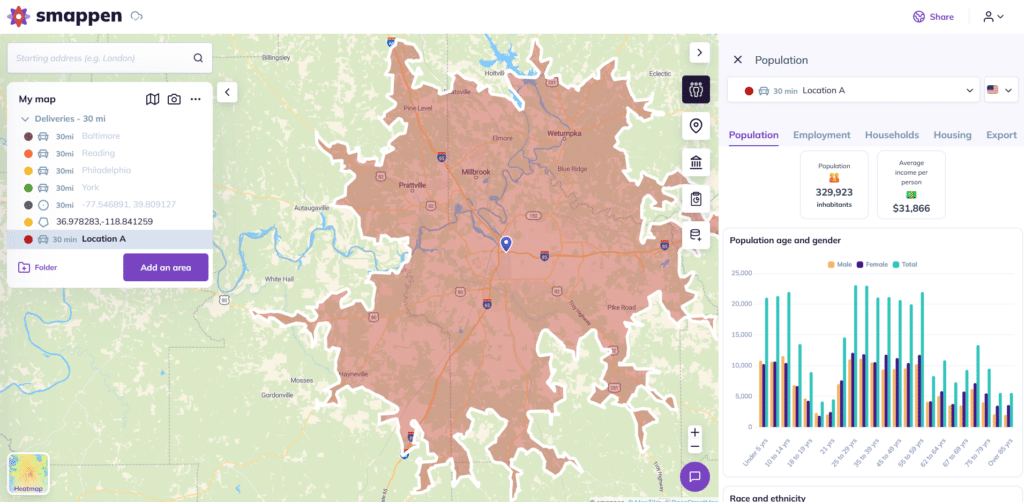
Build your crystal ball
Imagine having a crystal ball that uses data instead of magic. By looking at local demographics, like how many people live in the zone, their income levels, and their age groups, location-based analysis can give you a pretty good idea of how many potential customers you have.
It doesn’t stop there, though. Insights about the local economy and the competition might help you predict how well your franchise might perform in a given spot. Magic of spatial analysis! It’s like having a cheat code for success, guiding you to the spots where you can make the most sales.
Get a clear picture of your location performance
When you track data like sales and who’s buying from you, you can get a clear picture of how each franchise is doing.
You can easily spot which locations are thriving and which ones need a boost. It’s like having a dashboard that highlights where your strengths are and where you might need to make some tweaks. With these statistics, you can make informed decisions to optimize each location’s performance, ensuring every franchise is hitting its mark and contributing to overall success.
Optimizing supply chain and logistics
Having the right infrastructure in the right places: distribution efficiency
Find the best spots for warehouses and distribution centers by analyzing key factors like transportation routes, customer locations, and regional demand. By mapping out these elements, you can identify the most efficient and cost-effective locations that reduce delivery times and expenses. This ensures that your products get to your franchise locations quickly and smoothly, keeping shelves stocked and customers happy. It’s all about having the right infrastructure in the right places to streamline operations and boost efficiency.
Additionally, by ensuring that your supply chain is as streamlined as possible, you can avoid costly delays and stockouts, keeping your operations running smoothly.
Marketing and local promotions
Localized marketing strategies
Geospatial analysis is your secret weapon for creating marketing campaigns that hit the mark in specific areas. By diving into local demographics, you can tailor your marketing to fit the unique vibe of each place. Think about it: you’ll know exactly where your potential customers live, their age groups, income levels, and what they’re into.
This means you can craft promotions and ads that speak directly to the local crowd. Spatial analysis also helps you figure out the best ways to reach them, whether it’s through local media, social networks, or community events. Plus, it can show you the prime spots for billboards or the perfect places to host events and store openings.
With these insights, your marketing becomes more efficient and effective, making every dollar count. You’ll engage more deeply with your audience, boosting both loyalty and sales. It’s like being in sync with folks, making sure your ads really hit the mark.
Event planning
Spatial data is a fantastic tool for planning events and promotions that bring people to your franchise. By analyzing local demographics and consumer habits, you can identify prime locations like popular parks, busy shopping centers or community hubs and peak times for hosting events.
This way, you ensure that your events are in busy areas and reach the right people. Collaborating with nearby businesses can bring in more attendees to the event. You can plan events that draw in customers, boost sales, and enhance your brand presence.
Tools and technologies for spatial analysis
Several tools and technologies are commonly used in spatial analysis to collect, process, and interpret geographic data. Some of the most popular and powerful tools include:
Geographic Information Systems (GIS)
GIS is a framework for gathering, managing, and analyzing spatial and geographic data. It integrates hardware, software, and data for capturing, managing, analyzing, and displaying all forms of geographically referenced information. GIS tools are used for mapping and analyzing spatial data, performing spatial queries, and visualizing geographic information in various formats such as maps, charts, and reports.
Examples: ArcGIS, QGIS (Quantum GIS)
Location Intelligence software
Location intelligence software utilizes geographic data to provide insights and support decision-making processes across various industries. These tools analyze spatial data to identify trends, predict outcomes, and optimize business operations.
Examples: CARTO, Esri Business Analyst, Smappen
Mapping and visualization tools
These tools focus on creating visual representations of spatial data to enhance understanding and communication. They allow users to create maps, charts, and interactive visualizations to explore and present geographic information.
Examples: Mapbox, Tableau, Power BI with spatial plugins.
FAQ
Spatial analysis can be seen in various real-world applications that make a significant impact across different sectors. For example, for urban planning, it helps city planners design efficient public transportation routes by analyzing population density, commuter patterns, and traffic flow. This ensures that transit systems are optimally placed to serve the most people while reducing congestion.
In retail, companies use site selection to choose the best locations for new stores. By examining local demographics, income levels, and the proximity of competitors, businesses can predict where a new store will attract the most customers and generate the highest sales. This data-driven approach minimizes risks and maximizes returns on investment.
Another example is in environmental management. Spatial analysis is used to monitor deforestation, track wildlife migration patterns, and manage natural resources. By integrating satellite imagery and geographic insights, environmental scientists can identify areas at risk, plan conservation efforts, and assess the effectiveness of their strategies over time.
Healthcare also benefits from spatial analysis, particularly in epidemiology. So basically, when there’s a disease outbreak, health officials use maps to track how it’s spreading, find the trouble spots, and make sure resources are going where they’re needed most. This approach assists in controlling the spread and effectively targeting vaccination or treatment efforts.
In disaster management, geospatial analysis plays a crucial role in preparing for and responding to natural disasters. By analyzing geographic and environmental information, emergency planners can identify vulnerable areas, plan evacuation routes, and position resources strategically to mitigate the impact of disasters such as floods, earthquakes, or hurricanes.
These examples illustrate how spatial analysis leverages geographic data to solve complex problems, improve decision-making, and enhance efficiency across various fields.
A spatial analyst is a professional who specializes in interpreting and manipulating geographic data to solve problems, inform decisions, and create visual representations. Here’s a breakdown of what a spatial analyst typically does:
- Data Collection and Management: A spatial analyst gathers and manages geographic and spatial data from various sources, including satellite imagery, GPS data, surveys, and existing databases. They ensure data accuracy and integrity, often using Geographic Information Systems (GIS) software.
- Data Analysis: They analyze spatial data to identify patterns, trends, and relationships. This involves using techniques like overlay analysis, buffering, spatial interpolation, and hotspot analysis. For instance, they might analyze traffic patterns to identify the best location for a new retail store or study the spread of diseases to inform public health strategies.
- Visualization: Spatial analysts create maps, charts, and other visual tools to represent their findings. These visualizations help communicate complex spatial information in an accessible and understandable way. They often use GIS software to produce detailed and interactive maps.
- Modeling and Predictive Analysis: They develop and use models to predict future trends based on current and historical spatial data. For example, they might model urban growth to plan for future infrastructure needs or predict the impact of climate change on coastal areas.
- Problem Solving and Decision Support: Spatial analysts provide insights and recommendations to support decision-making processes. Their analyses help businesses, government agencies, and other organizations make informed decisions about resource allocation, planning, and development.
- Reporting and Documentation: They prepare detailed reports that document their findings, methodologies, and recommendations. These reports often include maps, charts, and other visual aids to help stakeholders understand the spatial relationships and implications of the data.
- Collaboration: Spatial analysts often work with other professionals such as urban planners, environmental scientists, public health officials, and business strategists. They provide the spatial perspective needed to complement other areas of expertise.
In essence, a spatial analyst uses geographic data to uncover insights, solve problems, and support strategic planning across various industries and applications. Their work is crucial in areas like urban planning, environmental conservation, public health, transportation, and many other fields where spatial relationships are key.
An example of spatial data is a city map that includes layers for different types of information. For instance, it might show:
- Locations of buildings: Each building is represented by a point or polygon that includes data about its address, height, and type (residential, commercial, etc.).
- Road networks: Lines represent streets, highways, and pathways, including attributes like road names, speed limits, and traffic flow.
- Land use zones: Areas are color-coded to show different land uses such as residential, commercial, industrial, and recreational spaces.
- Population density: A heatmap overlay might show areas of high and low population density, helping to visualize where people are concentrated within the city.
- Public amenities: Points or polygons for schools, hospitals, parks, and other public facilities, along with information about their services and capacities.
- Topography: Contour lines or elevation data showing the terrain of the area, including hills, valleys, and other geographical features.
This spatial data can be used for urban planning, navigation, public safety, and various analyses to make informed decisions about infrastructure development, resource allocation, and service provision.